Highcharts使用csv数据

Highcharts利用jQuery导入外部csv数据作图。

在使用Highcharts少量数据可以手动输入,但数据较多时最好先导入再作图。

比如我们想作一个儿童生长曲线图,相关数据可以从WHO网站获取,包括男女体重和身高从出生到5岁的中位数,百分位5-99范围内数据。

比如我们用女孩0-2周岁的身高数据做百分位25, 50, 75, 95曲线:

手动输入数据

 1
 2
 3
 4
 5
 6
 7
 8
 9
10
11
12
13
14
15
16
17
18
19
20
21
22
23
24
25
26
27
28
29
30
31
32
33
34
35
36
37
38
39
40
41
42
43
44
45
46
47
48
49
50
51
52
53
54
55
56
57
58
59
60
61
62
63
64
<!DOCTYPE html>
<html lang="en">
<head>
    <meta charset="UTF-8">
    <script src="https://code.highcharts.com/highcharts.js"></script>
    <script src="https://code.highcharts.com/modules/exporting.js"></script>
</head>
<body>
<center><div id="girl-height1" style="width: 75%;"></div></center>
<script>
Highcharts.chart('girl-height1', {
    chart: {
        type: 'spline',
        zoomType: 'x',
        style: {
            fontFamily: 'Arial'
        }
    },
    title: {
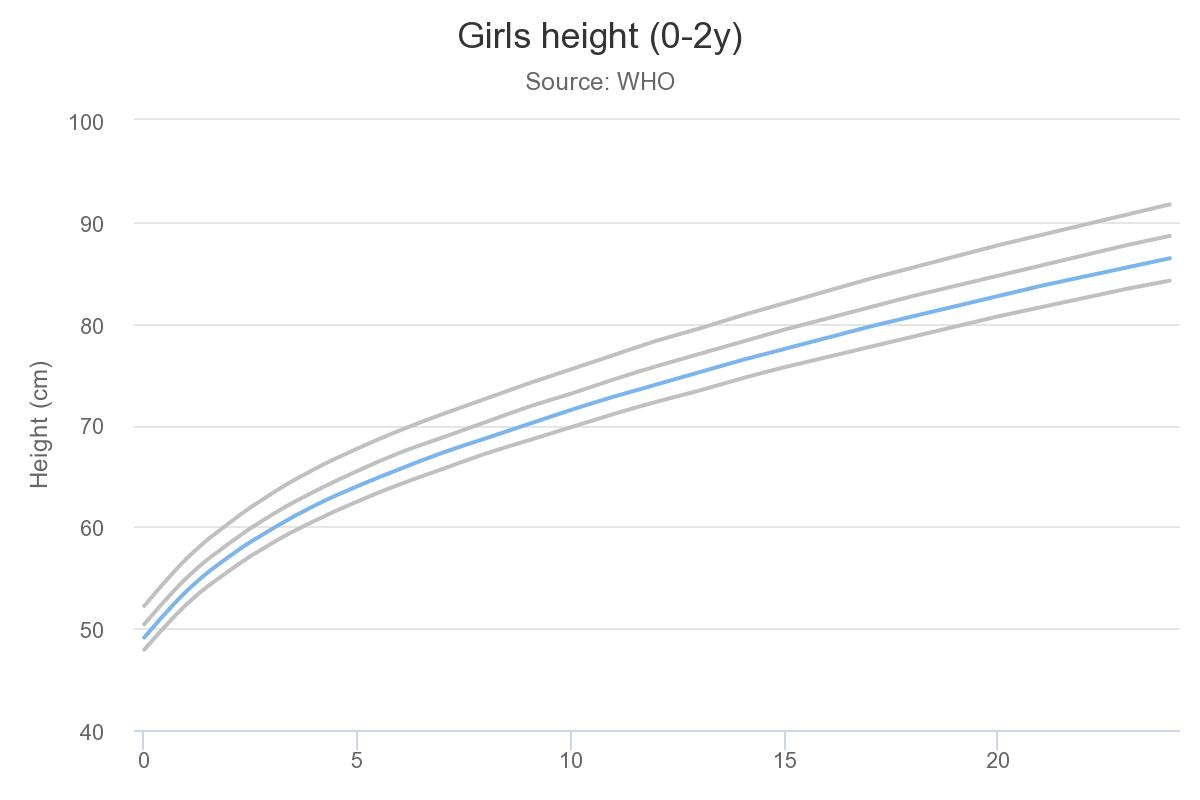
        text: 'Girls height (0-2y)'
    },
    subtitle: {
        text: 'Source: WHO'
    },
    yAxis: {
        title: {
            text: 'Height (cm)'
        }
    },
    legend: {
        enabled: false
    },
    credits:{enabled: false},
    plotOptions: {
        spline: {
            marker: {enabled: false},
            linewidth: 3
        },
        series: {
            name: 'Week',
            pointStart: 0
        }
    },
    series: [{
        name: '25%',
        color: '#c0c0c0',
        data: [47.9,52.4,55.7,58.4,60.6,62.5,64.2,65.7,67.2,68.5,69.8,71.1,72.3,73.4,74.6,75.7,76.7,77.7,78.7,79.7,80.7,81.6,82.5,83.4,84.2]
    }, {
        name: '50%',
        data: [49.1,53.7,57.1,59.8,62.1,64,65.7,67.3,68.7,70.1,71.5,72.8,74,75.2,76.4,77.5,78.6,79.7,80.7,81.7,82.7,83.7,84.6,85.5,86.4]
    }, {
        name: '75%',
        color: '#c0c0c0',
        data: [50.4,55,58.4,61.2,63.5,65.5,67.3,68.8,70.3,71.8,73.1,74.5,75.8,77,78.2,79.4,80.5,81.6,82.7,83.7,84.7,85.7,86.7,87.7,88.6]
    }, {
        name: '95%',
        color: '#c0c0c0',
        data: [52.2,56.9,60.4,63.3,65.7,67.7,69.5,71.1,72.6,74.1,75.5,76.9,78.3,79.5,80.8,82,83.2,84.4,85.5,86.6,87.7,88.7,89.7,90.7,91.7]
    }]

});
</script>
</body>
</html>

手动添加的好处是可以随意添加数据,并可自定义曲线颜色。

Highcharts可以借助jQuery中的.get功能导入csv。

首先提取数据到csv格式:

1
2
3
4
5
6
7
8
Month,P25,P50,P75,P95
0,47.9,49.1,50.4,52.2
1,52.4,53.7,55,56.9
2,55.7,57.1,58.4,60.4
3,58.4,59.8,61.2,63.3
4,60.6,62.1,63.5,65.7
5,62.5,64,65.5,67.7
...

导入csv 简易方法

 1
 2
 3
 4
 5
 6
 7
 8
 9
10
11
12
13
14
15
16
17
18
19
20
21
22
23
24
25
26
27
28
29
30
31
32
33
34
35
36
37
38
39
40
41
42
43
44
45
46
47
48
49
50
51
<!DOCTYPE html>
<html lang="en">
<head>
    <meta charset="UTF-8">
    <script src="https://code.jquery.com/jquery-3.2.1.min.js"></script>
    <script src="https://code.highcharts.com/highcharts.js"></script>
    <script type="text/javascript" src="https://code.highcharts.com/modules/data.js"></script>
    <script src="https://code.highcharts.com/modules/exporting.js"></script>
    <title>Child growth curve</title>
    <!-- data source: https://www.who.int/childgrowth/standards/height_for_age/en/ -->
</head>
<body>
<script type="text/javascript">
$(document).ready(function() {
	$.get('data.csv', function(csv) {
	    $('#girl-height2').highcharts({
	        chart: {
	        	type: 'spline'
	        },
	        data: {
	            csv: csv,
	        },
	        title: {
		    text: 'Girl Weight (0-5y)'
		},
		legend: {
		    enabled: false
		},
		plotOptions: {
        	    spline: {
            		marker: {enabled: false},
            		linewidth: 3
        	    },
        	    series: {
            		pointStart: 0,
            		color: 'grey'
        	    }
    		},
    		credits: {enabled: false},
		yAxis: {
		    title: {
			text: 'Weight (kg)'
			}
		}
	    });
	});
});
</script>
<center><div id="girl-height2" style="width: 75%"></div></center>
</body>
</html>

一切正常:

导入csv 读取行添加到分类(categories)和数据(series)

 1
 2
 3
 4
 5
 6
 7
 8
 9
10
11
12
13
14
15
16
17
18
19
20
21
22
23
24
25
26
27
28
29
30
31
32
33
34
35
36
37
38
39
40
41
42
43
44
45
46
47
48
49
50
51
52
53
54
55
56
57
58
59
60
61
62
63
64
65
66
<div id="girl-height3" style="width: 80%; margin: 0 auto"></div>

<script>
    var options = {
    chart: {
        renderTo: 'girl-height3',
        defaultSeriesType: 'spline'
    },
    title: {
        text: 'Girl weight'
    },
    xAxis: {
        categories: []
    },
    yAxis: {
        title: {
            text: 'Weight (kg)'
        }
    },
    series: []
};

$.get('data.csv', function(data) {
    // Split the lines
    var lines = data.split('\n');

    // Iterate over the lines and add categories or series
    $.each(lines, function(lineNo, line) {
        var items = line.split(',');

        // header line contains categories
        if (lineNo == 0) {
            $.each(items, function(itemNo, item) {
                if (itemNo > 0) options.xAxis.categories.push(item);
            });
        }

        // the rest of the lines contain data with their name in the first
        // position
        else {
            var series = {
                data: []
            };
            $.each(items, function(itemNo, item) {
                if (itemNo == 0) {
                    series.name = item;
                } else {
                    series.data.push(parseFloat(item));
                }
            });

            options.series.push(series);

        }

    });

    // Create the chart
    var chart = new Highcharts.Chart(options);
});
</script>
~~~~~

问题来了:回原数据data是纵向的,这里以line为单位就把类别和数据弄反了,需要把原数据转换一下;第二个问题是原数据只有24组数,这里平白无故又多出来个series 26比较怪异。

<img src="girl-height2.jpeg" width="100%" />
comments powered by Disqus
CC-BY-NC 4.0
Built with Hugo Theme Stack