I have a list of genes that belong to different groups. I would like to plot the expression using heatmap and show different colours for each group. I will use pheatmap in R.
These are the files I have:
1
2
3
4
5
|
group_1.ids
group_2.ids
group_3.ids
group_4.ids
meanExpr_male.txt
|
The *.ids contains gene ids in that group and meanExpr contain the expression values in different timepoints. I will use the following command to creat the input file for pheatmap:
for i in *.ids; do awk '{print $0, FILENAME}' $i | sed 's/\.ids//'; done | sort| join - meanExpr_male.txt |sort -k2 > expression_male.txt
After adding the header it looks like this:
1
2
3
4
|
id group ZT0_108 ZT4_112 ZT8_116 ZT12_322 ZT16_302 ZT20_306 ZT0_208 ZT4_212 ZT8_216 ZT12_422 ZT16_402 ZT20_406
Smp_004990 group_1 11.6238860923885 11.7012985083805 11.7080728413716 11.7449291329324 11.871302294887 11.8337040129681 11.5422342687382 11.5492732385306 11.5436784547167 11.7232064962793 11.7978806500245 11.6801605209344
Smp_083080 group_2 11.8692180702093 11.8637716673112 11.960798606599 12.0342219282721 12.1998411797624 12.072845488565 11.8119612521527 11.7907920979337 11.7571910861473 11.9918482362759 12.0969133775094 11.8185835100524
...
|
To make a heatmap, I used the following script:
 1
 2
 3
 4
 5
 6
 7
 8
 9
10
11
12
13
14
15
16
17
18
19
20
21
|
library(pheatmap)
library(RColorBrewer)

# in this script the 2nd column in the expression file is the group names
exp<-read.delim("expression_male.txt", sep=" ",header=T)

z<-exp[,-1:-2]
rownames(z)<-exp[,1]
zz<-as.matrix(z)

# add group annotation
anno<-data.frame(row.names=exp$id, Group=exp$group)

# creat colours for each group
newCols <- colorRampPalette(grDevices::rainbow(length(unique(anno$group))))
annoCol <- newCols(length(unique(anno$group)))
names(annoCol) <- unique(anno$group)
annoCol <- list(category = annoCol)

# make the heatmap
pheatmap(zz, scale = "row", cluster_cols = F, cluster_rows = F, annotation_row = anno, annotation_colors = annoCol, cellheight = 10, cellwidth = 10, file = "expr_group.png")
|
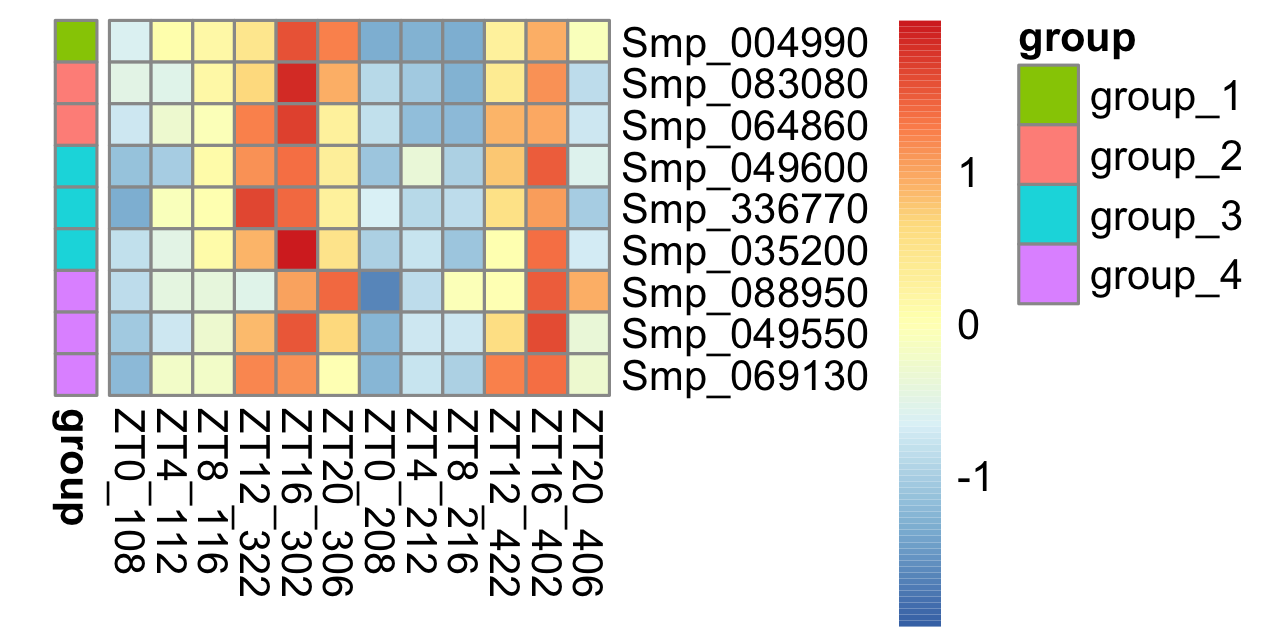
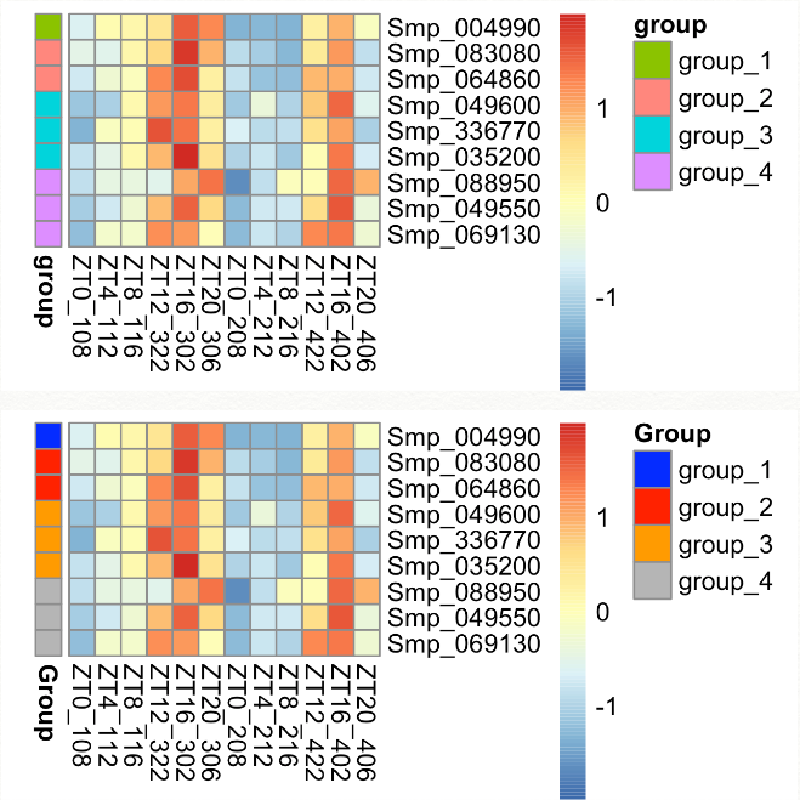
The heatmap looks like this:

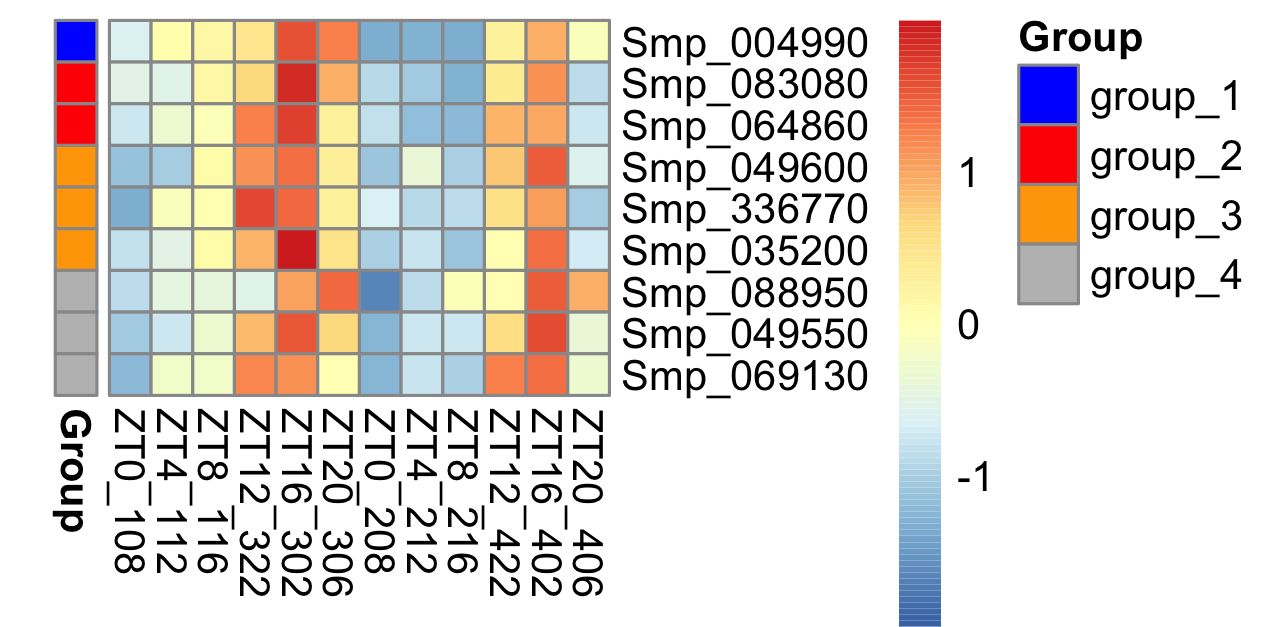
Then I would like to define the colour for each group:
1
2
3
4
5
6
7
|
...
# add group annotation
anno<-data.frame(row.names=exp$id, Group=exp$group)

# define the colours
annoCol<-list(Group=c(group_1="blue", group_2="red", group_3="orange", group_4="grey"))
...
|

Another thing is that some special characters like “+ -” are not allowed in R variables but commonly used in biology, e.g. Co-chaperone. In this case, we need to force R to use that variable name by adding backticks, e.g.,
group_1="blue", ...`Co-chaperone`="blue"


