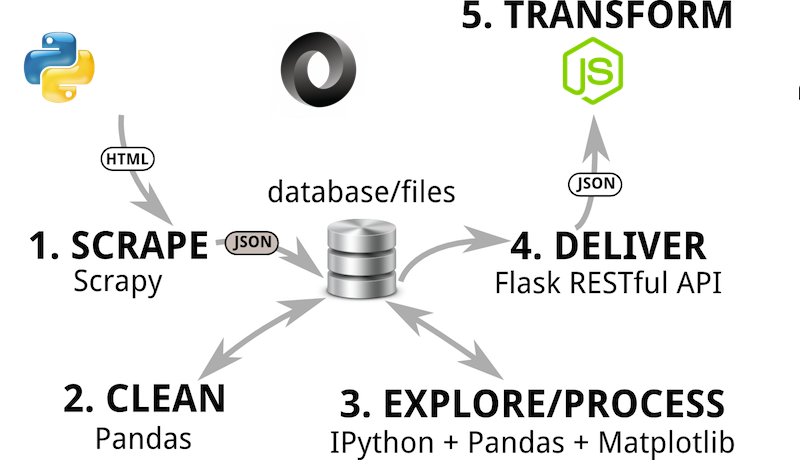
(Image modified from Kyran Dale.)
最早接触json是在一年前自己搭建一个寄生虫的数据网站(Tremato.de),想要实现静态网站的搜索功能。发现一个比较巧妙的方法,是将各网页的title, keywords, url等等自定义域信息写入json文件,通过javascript调用实现。
这几天正在学习Python和js数据可视化。Python自带json模块,读取写入json比较方便。JS可视化也有很棒的库并且调用json也算快捷。
JSON格式
JSON是含有key-value数据的信息块,用{}括起来,有点类似于python的dictionary。Value可以是多种类型:string, number, object, array, Boolean 或 null。
下面是一个比较复杂的json数据:(来源于DigitalOcean.com)
 1
 2
 3
 4
 5
 6
 7
 8
 9
10
11
12
13
14
15
16
17
18
19
20
21
22
23
24
25
26
27
28
29
|
{
  "first_name" : "Sammy",
  "last_name" : "Shark",
  "location" : "Ocean",
  "websites" : [
    {
      "description" : "work",
      "URL" : "https://www.digitalocean.com/"
    },
    {
      "desciption" : "tutorials",
      "URL" : "https://www.digitalocean.com/community/tutorials"
    }
  ],
  "social_media" : [
    {
      "description" : "twitter",
      "link" : "https://twitter.com/digitalocean"
    },
    {
      "description" : "facebook",
      "link" : "https://www.facebook.com/DigitalOceanCloudHosting"
    },
    {
      "description" : "github",
      "link" : "https://github.com/digitalocean"
    }
  ]
}
|
Python写入、读取json
有点类似于pickle用法
1
2
3
4
5
6
7
8
9
|
import json

# Writing JSON data
with open('data.json', 'w') as f:
     json.dump(data, f)

# Reading data back
with open('data.json', 'r') as f:
     data = json.load(f)
|
导出Object (see here:)
 1
 2
 3
 4
 5
 6
 7
 8
 9
10
|
class User(object):
    def __init__(self, name, password):
        self.name = name
        self.password = password
alice = User('Alice A. Adams', 'secret')

def jdefault(o):
    return o.__dict__
print(json.dumps(alice, default=jdefault))
# outputs: {"password": "secret", "name": "Alice A. Adams"}
|
JS导入json数据,以Highcharts为例, 使用jQuery的getJSON:
 1
 2
 3
 4
 5
 6
 7
 8
 9
10
11
12
13
14
15
16
17
18
19
20
|
$(function () {
    $.getJSON('JSON URL', function(data) {
        // Populate series
        for (i = 0; i < data.length; i++){
            processed_json.push([data[i].key, data[i].value]);
        }

        $('#container').highcharts({
          chart: {
	      type: 'column'
          },
	  series: [{
	      name: 'Values',
	      data: processed_json,
	      color: 'blue',
	      negativeColor: 'red'
	  }]
        });
    });
)};
|
Example 1, Example 2.