HTML presentation is powerful especially when you want to integrate some interactive charts (many are powered by JavaScript, e.g., D3, Highcharts, E-charts.). Althought this can also be achived by R Shinny, it’s not easy to get start with and you need both R and RStudio installed. In contrast, HTML and Javascript are nearly supported in all platforms, including mobile phones and tablets. There are alreay available free html presentation frameworks in JavaScript, including reveal.js and remark.js, but they might have compatibility problems with other JS libararies (e.g., when combined reveal.js and highcharts.js quite often the position of tooltips in the chart are shifted).
I am thinking to build a simple html presentation framwork with some basic concepts:
- It’s single html so you just need one <head> for external scripts
- each slide is a <section>, so it’s easy to add or delete
- can use arrowkeys to navigate
The key point is that one needs to hide all other sections on start, and display them via hyperlinks or Keypress events. I came across the tutorial on w3schools, which meets basic needs.
First define the ratio (16:9) and then hide all sections:
|
|
The transitions is controlled by click event:
|
|
and defined by JS function:
|
|
Finally to map the keydown events to the onclick function:
|
|
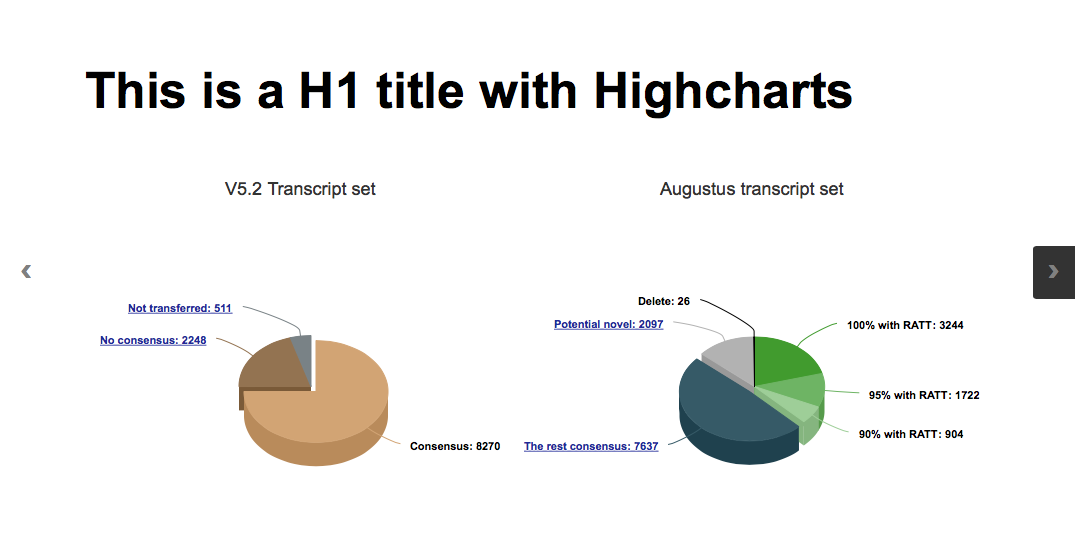
Add charts to the slides you will have no conflicts: