1
2
|
# select cells without "melanoma" in the combined_clusters col
subdata<-data[, !grepl("melanoma", data@meta.data$combined_clusters)]
|
but if we check the levels of subdata, cells with “melanoma” are stil in
1
2
3
4
5
6
|
table(subdata$combined_clusters)

                               CAFs                            immune 1                     keratinocytes 3
                                195                                 162                                 127
                           immune 2                melanoma mesenchymal
                                106                                   0
|
this will cause error if we run RCTD:
process_cell_type_info error: need a minimum of 25 cells for each cell type in the reference
solution 1: set combined_clusters as default Idents of subdata
1
2
|
subdata<-SetIdent(subdata, value = subdata$combined_clusters)
levels(subdata@active.ident)
|
solution 2: drop levels
1
2
|
subdata$combined_clusters<-droplevels(subdata$combined_clusters, exclude=c("melanoma mesenchymal"))
table(subdata$combined_clusters)
|
1
2
3
|
DefaultAssay(SeuObj)<-"RNA"
SeuObj<-SetIdent(SeuObj, value=SeuObj@meta.data[["colname"]])
deg<-FindAllMarkers(SeuObj)
|
rename clusters
1
2
3
|
new_cluster.ids<-c("late germ cells", "intermediate germ cells", "GSC/GSC progeny")
names(x=new_cluster.ids)<-levels(x=SeuObj)
SeuObj <- RenameIdents(object = SeuObj, new_cluster.ids)
|
1
2
|
SeuObj$new_col<-dataframe$col2merge[match(rownames(SeuObj@meta.data), rownames(dataframe))]
# or cbind if rownames are in the same order
|
DimPlot and FeaturePlot
1
2
3
4
|
# DimPlot on another col
DimPlot(SeuObj, group.by="colname", cols=myCol)
# FeaturePlot
FeaturePlot(SeuObj, features="colname", split.by="groupname")+scale_colour_gradientn(colours=brewer.pal(n=9, name="YlOrRd"))
|
change NAs in col to “ambiguous”
1
|
SeuObj$colname[which(is.na(SeuObj$colname))]<-"ambiguous"
|
1
2
3
4
5
|
# add raw count to metadata
SeuObj$Sox10<-SeuObj@assays$RNA@counts["Sox10",]

# correlation scatter
ggplot(SeuObj@meta.data, aes(colname, Sox10))+geom_point()
|
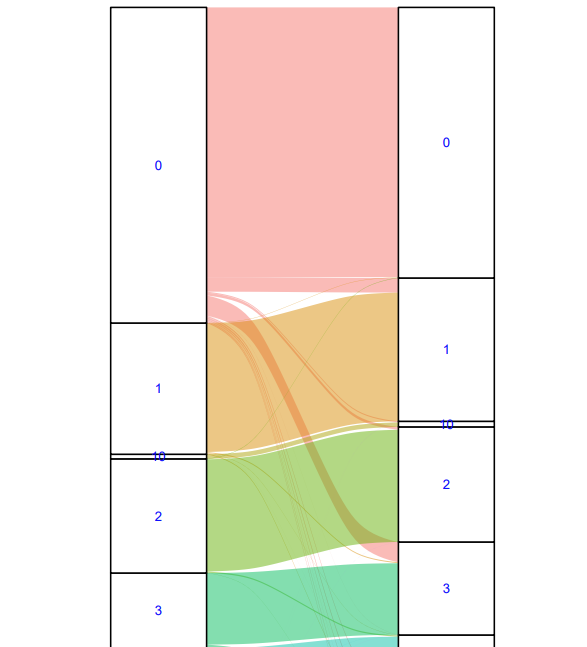
eg. compare cell annotation results or different res
1
2
3
4
5
|
meta.sel<-SeuObj@meta.data[, c("col1", "col2")]
sankeyform<-highcharter::data_to_sankey(meta.sel)

ggplot(as.data.frame(sankeyform), aes(y=weight, axis1=from, axis2=to))+geom_flow(aes(fill=from, na.rm=FALSE), width=1/3)+
  geom_stratum(width=1/3)+geom_text(stat="stratum", aes(label=after_stat(stratum), size=3, color="blue"))+guides(fill="none")
|