Featured image of post Define plot colors from a file column in R

Define plot colors from a file column in R

The color attribute needs to be characters.

I need to make some barplots using data from a file:

1
2
3
4
5
go_name	-log10fdr	cell_type	color
motor activity	2.27572413	Actin2+ muscle	#1B5E20
actin cytoskeleton	1.698970004	Actin2+ muscle	#1B5E20
supramolecular fiber	3.346787486	Positional muscle	#00c853
motor activity	2.142667504	Positional muscle	#00c853

So I imported the data into R

1
2
3
4
5
6
7
siggo<-read.delim("sigGOterms.txt", sep="\t", header=T)
# choose those with -log10FDR > 2
siggo001<-siggo[which(siggo$X.log10fdr>2),]
# reverse the row orders
siggo001<- siggo001[seq(dim(siggo001)[1],1),]
# make barplots
barplot(siggo001$X.log10fdr, names.arg=siggo001$go_name, col=siggo001$color, horiz = T, las=2)

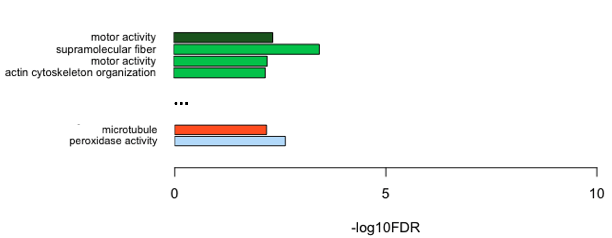
But the color does’t match those supplied in the column color

r-color

If we check the column in R, the hex values were treated as factors.

1
2
3
4
5
> siggo001$color
 [1] #BBDEFB #FF5722 #FF5722 #FF5722 #FF5722 #DD2C00 #DD2C00 #DD2C00 #DD2C00

> class(siggo001$color)
[1] "factor"

So we need take the color values as characters:

1
2
3
4
5
6
7
> siggo001$color<-as.character(siggo001$color)
> siggo001$color
 [1] "#BBDEFB" "#FF5722" "#FF5722" "#FF5722" "#FF5722" "#DD2C00" "#DD2C00"

# useful: names.arg, horiz, las, xpd, xex.names
> barplot(siggo001$X.log10fdr, names.arg=siggo001$go_name, col=siggo001$color, horiz = T, las=2, xlim=c(0,10), xpd=F, border="black", cex.names=0.78, xlab="-log10FDR", axes=F)
> axis(1, at=seq(0,10,by=5), las=0)

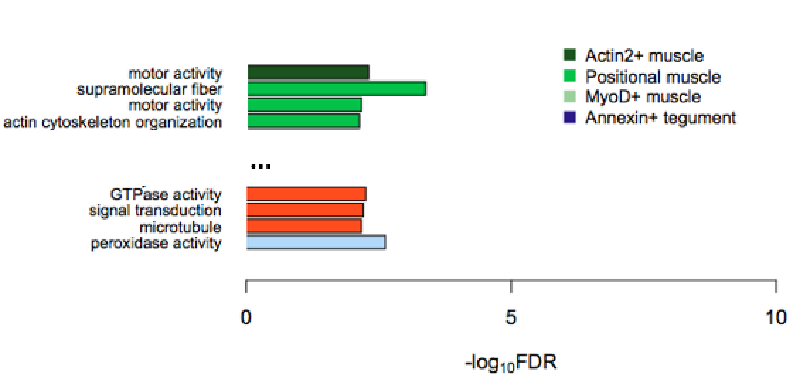
Now the colors are quite as set now.

r-color2

Can also add a legend:

1
2
3
4
5
barplot(siggo001$X.log10fdr, names.arg=siggo001$go_name, col=siggo001$color, horiz = T, las=2, xlim=c(0,10), xpd=F, border="black", cex.names=0.78, xlab=expression(paste("-log"[10], "FDR")), axes=F)
# add x axis and label, paralell to axis
axis(1, at=seq(0,10,by=5), las=0, labels=c("0", "5", "10"))
# add legend, define the shap, size, and reverse the order
legend("topright", legend=unique(rev(siggo001$cell_type)), col=unique(rev(siggo001$color)), pch=15, bty="n", cex=0.85, pt.cex=1.3)
comments powered by Disqus
CC-BY-NC 4.0
Built with Hugo Theme Stack