There are already studies focused on modelling histone modification levels and gene expression. For instance Karlić et al 2010 PNAS used linear models (tag counts with all or different combinations of modification in [-2k, +2k] around TSS) and achieved a correlation r=0.77 on the full model, and interestingly r=0.72 using a single modification. Dong et al 2012 Genome Bio improved the modelling by using different regions (around TSS, gene body, around TES) for different marks, and two-step modelling (Random Forest for classifying regions and linear regression for prediction). They achieved an incredible Pearson r = 0.9 and RMSE = 1.9.
There is also one interesting reviewing on the interplay of different histone modifications by Zhang et al 2015 EMBO Rep where they summarised the enriched regions of different histone marks.

I could use this information to assign regions to different marks, i.e.,
Activative:
- H3K4me3: near TSS
- H4K20me1: near TSS
- H3K9ac/H3K23ac/H4K12ac: gene body
- H3K36me3: near TES
Repressive:
- H3K9me3: promoter region
- H3K27me3: near TSS
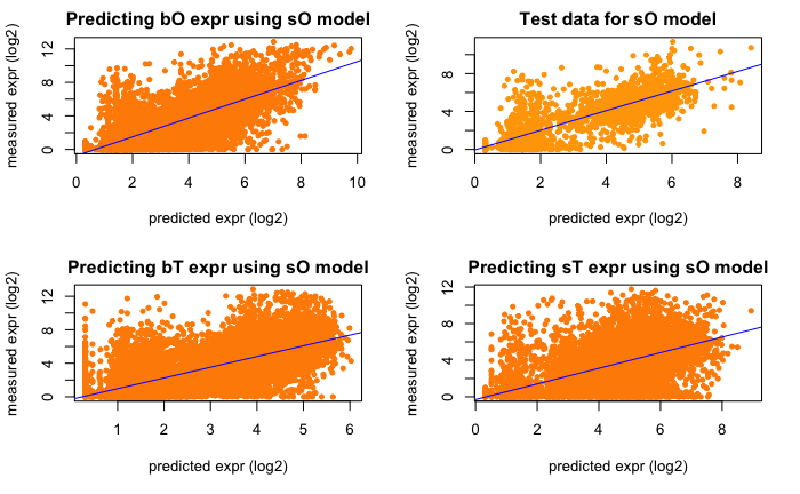
I used mark counts instead of read counts for modelling: expression ~ different marks and could obtain good correlation using SVM, Regression Trees, Neural networks, and Random Forest.
|
|
I guess the model can be further improved by using cross-validation but it indicated that in schistos the modification and expression can be modelled.