The input file is sorted by cluster name and start coordinate of the genes like this
 1
 2
 3
 4
 5
 6
 7
 8
 9
10
11
12
13
14
15
16
17
18
|
       chr         id    start      end strand          pfam
1  SM_V7_1 Smp_178420 48981354 48982520      - PF00001-7tm_1
2  SM_V7_1 Smp_319310 48986134 48988127      + PF00001-7tm_1
3  SM_V7_1 Smp_137300 48989538 48995030      - PF00001-7tm_1
4  SM_V7_1 Smp_137310 49003945 49005340      - PF00001-7tm_1
5  SM_V7_1 Smp_027940 49008050 49010380      - PF00001-7tm_1
6  SM_V7_1 Smp_137320 49025011 49029650      - PF00001-7tm_1
7  SM_V7_1 Smp_048050 65566436 65626137      + PF00011-HSP20
8  SM_V7_1 Smp_302270 65574596 65576347      + PF00011-HSP20
9  SM_V7_1 Smp_049230 65585301 65587122      - PF00011-HSP20
10 SM_V7_1 Smp_302280 65594848 65596602      - PF00011-HSP20
...
383 SM_V7_ZW Smp_137740  8280487  8305005      - PF17039-Glyco_tran_10_N
384 SM_V7_ZW Smp_336380  8321149  8334825      + PF17039-Glyco_tran_10_N
385 SM_V7_ZW Smp_142860  8337999  8348552      + PF17039-Glyco_tran_10_N
386 SM_V7_ZW Smp_306350 62981689 62988318      + PF17039-Glyco_tran_10_N
387 SM_V7_ZW Smp_333000 63016429 63024590      + PF17039-Glyco_tran_10_N
388 SM_V7_ZW Smp_099090 63053639 63061327      + PF17039-Glyco_tran_10_N
|
I have previously used a for loop to manually calculate the distances. After a bit of searching, there seems much easier solutions to calculate the distance (difference) between the end coordinate of gene A to the start coordinate of next gene within each pfam group
For instance using dplyr (lag function):
 1
 2
 3
 4
 5
 6
 7
 8
 9
10
11
12
13
14
15
16
17
18
19
|
library(dplyr)
pfamCoord<-read.delim("cluster_geneCoord.txt", sep="\t", header=T)
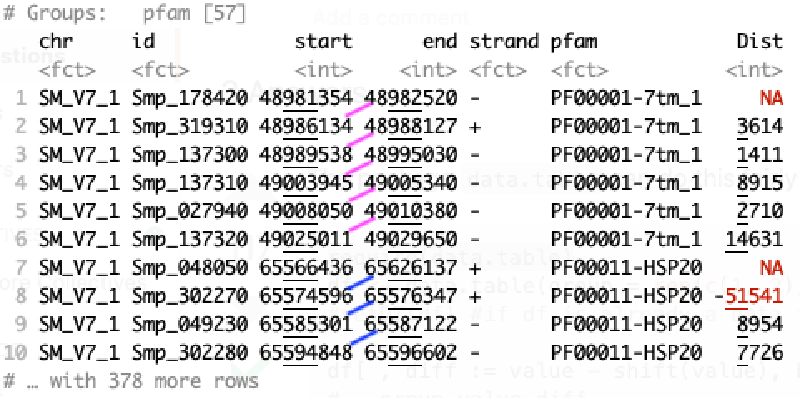
pfamCoord %>% group_by(pfam) %>% mutate(Dist = start - lag(end))
# A tibble: 388 x 7
# Groups: pfam [57]
chr id start end strand pfam Dist
<fct> <fct> <int> <int> <fct> <fct> <int>
1 SM_V7_1 Smp_178420 48981354 48982520 - PF00001-7tm_1 NA
2 SM_V7_1 Smp_319310 48986134 48988127 + PF00001-7tm_1 3614
3 SM_V7_1 Smp_137300 48989538 48995030 - PF00001-7tm_1 1411
4 SM_V7_1 Smp_137310 49003945 49005340 - PF00001-7tm_1 8915
5 SM_V7_1 Smp_027940 49008050 49010380 - PF00001-7tm_1 2710
6 SM_V7_1 Smp_137320 49025011 49029650 - PF00001-7tm_1 14631
7 SM_V7_1 Smp_048050 65566436 65626137 + PF00011-HSP20 NA
8 SM_V7_1 Smp_302270 65574596 65576347 + PF00011-HSP20 -51541
9 SM_V7_1 Smp_049230 65585301 65587122 - PF00011-HSP20 8954
10 SM_V7_1 Smp_302280 65594848 65596602 - PF00011-HSP20 7726
# … with 378 more rows
|
or using data.table (shift function)
 1
 2
 3
 4
 5
 6
 7
 8
 9
10
11
12
13
14
15
16
17
18
|
library(data.table)
setDT(pfamCoord)
pfamCoord[, Dist := start - shift(end), by = pfam]
head(pfamCoord, 10)

        chr         id    start      end strand          pfam   Dist
 1: SM_V7_1 Smp_178420 48981354 48982520      - PF00001-7tm_1     NA
 2: SM_V7_1 Smp_319310 48986134 48988127      + PF00001-7tm_1   3614
 3: SM_V7_1 Smp_137300 48989538 48995030      - PF00001-7tm_1   1411
 4: SM_V7_1 Smp_137310 49003945 49005340      - PF00001-7tm_1   8915
 5: SM_V7_1 Smp_027940 49008050 49010380      - PF00001-7tm_1   2710
 6: SM_V7_1 Smp_137320 49025011 49029650      - PF00001-7tm_1  14631
 7: SM_V7_1 Smp_048050 65566436 65626137      + PF00011-HSP20     NA
 8: SM_V7_1 Smp_302270 65574596 65576347      + PF00011-HSP20 -51541
 9: SM_V7_1 Smp_049230 65585301 65587122      - PF00011-HSP20   8954
10: SM_V7_1 Smp_302280 65594848 65596602      - PF00011-HSP20   7726

#setDF(pfamCoord) # convert back to old data.frame syntax
|
Finally we can summarise the differences (Dist) by group (pfam)
 1
 2
 3
 4
 5
 6
 7
 8
 9
10
11
12
13
14
15
16
17
18
|
pfamCoord %>% group_by(pfam) %>% summarise(minDist=min(Dist, na.rm = TRUE), maxDist=max(Dist, na.rm = TRUE))

`summarise()` ungrouping output (override with `.groups` argument)

# A tibble: 57 x 3
   pfam                  minDist  maxDist
   <fct>                   <int>    <int>
 1 PF00001-7tm_1       -14237049 37313397
 2 PF00011-HSP20          -51541    54921
 3 PF00012-HSP70            4828     4842
 4 PF00014-Kunitz_BPTI      3703    46064
 5 PF00026-Asp             11392    28849
 6 PF00041-fn3              1212     1327
 7 PF00079-Serpin          20471    45424
 8 PF00089-Trypsin      -3348130   138508
 9 PF00096-zf-C2H2          5770    15632
10 PF00106-adh_short   -43497156 53670503
# … with 47 more rows
|
or to summarise by pfam on each chr, because some pfam clusters exist on multiple chromosomes.
 1
 2
 3
 4
 5
 6
 7
 8
 9
10
11
12
13
14
15
16
17
|
pfamCoord %>% group_by(pfam, chr) %>% summarise(minDist=min(Dist, na.rm = TRUE), maxDist=max(Dist, na.rm = TRUE))

# A tibble: 67 x 4
# Groups:   pfam [57]
   pfam                chr        minDist  maxDist
   <fct>               <fct>        <int>    <int>
 1 PF00001-7tm_1       SM_V7_1       1411    14631
 2 PF00001-7tm_1       SM_V7_3   -9539472  1870737
 3 PF00001-7tm_1       SM_V7_4  -14237049    20454
 4 PF00001-7tm_1       SM_V7_ZW    -17590 37313397
 5 PF00011-HSP20       SM_V7_1     -51541    54921
 6 PF00012-HSP70       SM_V7_1       4828     4842
 7 PF00014-Kunitz_BPTI SM_V7_2       3703    46064
 8 PF00026-Asp         SM_V7_3      11392    28849
 9 PF00041-fn3         SM_V7_ZW      1212     1327
10 PF00079-Serpin      SM_V7_6      20471    45424
# … with 57 more rows
|
Some distances are minus because genes are overlapped.