Below are a few steps to perform one-way ANOVA and multiple comparisons in R.
Read data
1
2
3
4
5
6
7
8
|
> data
   sample    m1   m2   m3
1 sample1 31226  944 2291
2 sample1 41729 1114 2687
3 sample2 22839  451 1501
4 sample2 44998  564 1786
5 sample3 22880  427 2518
6 sample3 19244  292 2130
|
anova
 1
 2
 3
 4
 5
 6
 7
 8
 9
10
11
12
|
> fit1<-aov(m1~sample, data=data)
> summary(fit1)
            Df    Sum Sq   Mean Sq F value Pr(>F)
sample       2 272983809 136491905   1.333  0.385
Residuals    3 307277393 102425798

> fit2<-aov(m2~sample, data=data); summary(fit2)
            Df Sum Sq Mean Sq F value Pr(>F)
sample       2 494731  247366   24.78 0.0136 *
Residuals    3  29947    9982
+++
Signif. codes:  0 ‘***’ 0.001 ‘**’ 0.01 ‘*’ 0.05 ‘.’ 0.1 ‘ ’ 1
|
Multiple comparison (TukeyHSD method)
 1
 2
 3
 4
 5
 6
 7
 8
 9
10
11
|
>TukeyHSD(fit2)
  Tukey multiple comparisons of means
    95% family-wise confidence level

Fit: aov(formula = m2 ~ sample, data = data)

$sample
                  diff       lwr      upr     p adj
sample2-sample1 -521.5  -939.007 -103.993 0.0276687
sample3-sample1 -669.5 -1087.007 -251.993 0.0138238
sample3-sample2 -148.0  -565.507  269.507 0.4129937
|
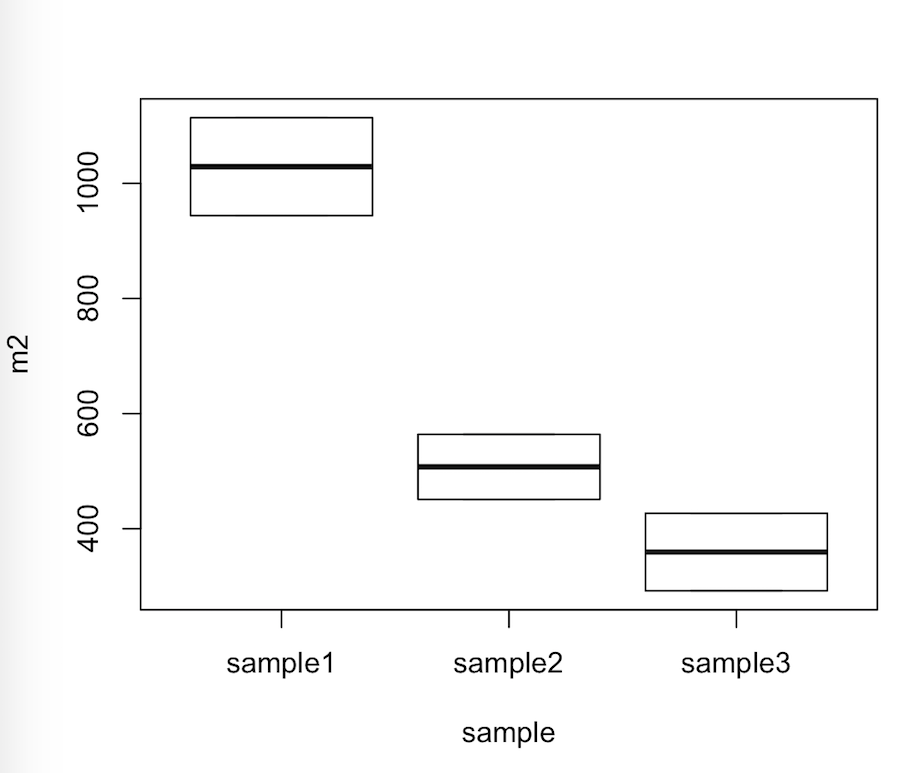
Plot
1
|
> plot(m2~sample, data=data)
|