Figure source: topGO manual
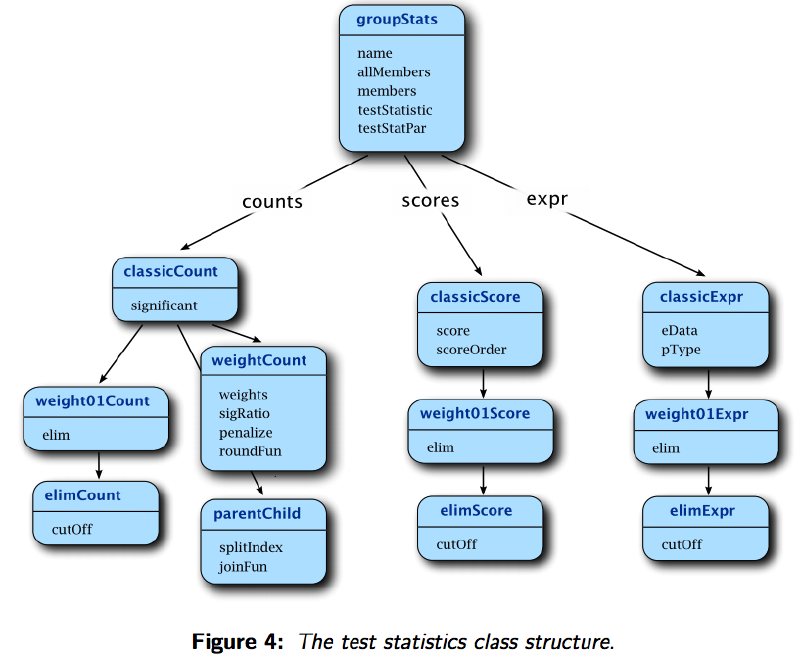
The most popular method to test GO enrichment in a list of genes is to use Hypegeometric test (one-side Fisher’s test). This method is based on genes counts for each GO term, but not considering like p-value or other weights. In fact, topGO supports three testing methods (see the manual):
- Tests based on gene counts. This is the most popular family of tests, given that it only requires the presence of a list of interesting genes and nothing more. Tests like Fisher’s exact test, Hypegeometric test and binomial test belong to this family. Draghici et al. (2006)
- Tests based on gene scores or gene ranks. It includes Kolmogorov-Smirnov like tests (also known as GSEA), Gentleman’s Category, t-test, etc. Ackermann and Strimmer (2009)
- Tests based on gene expression. Tests like Goeman’s globaltest or GlobalAncova separates from the others since they work directly on the expression matrix. Goeman and Buhlmann (2007)
For the ks test, we can use gene ranks such as DGE p-values or fold-change values, or other ranking measurements. Nitsuaq here nicely discussed the difference between fisher and ks tests:
Fisher and ks are just two ways of answering the same question: are the most significant genes enriched for any particular GO term annotations? Fisher’s exact test compares the expected number of significant genes at random to the observed number of significant genes to arrive at a probability. The KS test compares the distribution of gene p-values expected at random to the observed distribution of the gene p-values to arrive at a probability. KS is theoretically the better choice because it does not require an arbitrary p-value threshold.
Back to the code part, the main difference from fisher’s test is that there is a gene selection function for geneList in the topGOdata object:
|
|
Here the geneSel function is called mySel. And unfortunately the current selection function only supports a simple score cutoff, rather than complex filtering and self-provided gene list (See the post here). So the gene scores need to be continuous, e.g., p-value cutoff for selecting DEGs.
|
|
In Fisher’s test, the geneList is simply a list of gene names, but for the ks test we need to store the gene scores in the toGOdata object, by providing the scores in geneList like this:
|
|
This can be done from importing the GO annotation file (“refGO”) with scores:
|
|
and assign the score values to geneList and turn it to numeric:
|
|
Now if we check the topGOdata object the scores are stored there, which are not present in Fisher’s test
|
|
Finally we can run the ks test:
resultWeight01KS <- runTest(myGOdata,algorithm="weight01",statistic="ks")
Of course we also would like to put genes for each significant term to GenTable from the significant list (see the complete [topGOdata class](topGodata class: https://www.rdocumentation.org/packages/topGO/versions/2.24.0/topics/topGOdata-class)):
|
|
But it seems that the ks test can only identify significant GO terms that are different between the selection and the rest, it won’t tell you which is enrichment in your gene selection (see the post from Fabio Marroni, who showed that the KS p-values and terms are the same for selecting either expressed or non-expressed genes), and the impression also gave that
the fisher test with p<0.01 and weight01 algorithm seemed to identify the informative GO terms, whereas KS and weight01 tended to identify very basic GO terms like biological process, or cellular process. – https://www.biostars.org/p/247636/