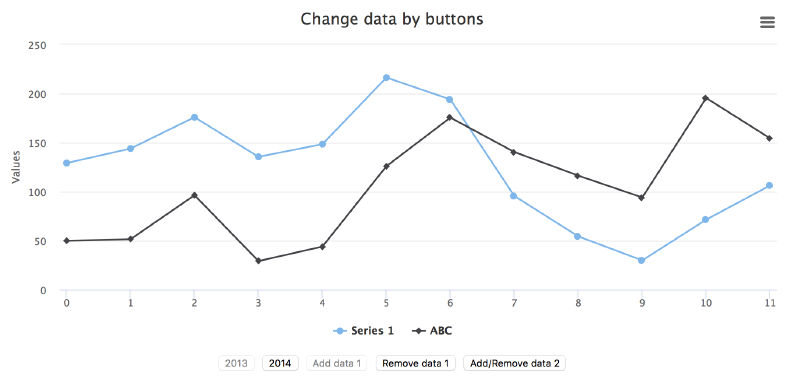
First we want to change the default data series (or any other) (default using “2014”) by switching buttons. For instance we change the data to “2013” by click the “2013” button and change back to “2014” by its button:
Because we loaded data “2014” by default, we disable this button at start.
Then use jQuery to set click function on these two buttons, including disable itself after click and active the other one:
 1
 2
 3
 4
 5
 6
 7
 8
 9
10
11
12
// The button action
$('#2013').click(function(){chart2.series[0].setData([129.2,144.0,176.0,135.6,148.5,216.4,194.1,95.6,54.4,29.9,71.5,106.4]);$(this).attr('disabled',true);$('#2014').attr('disabled',false);});$('#2014').click(function(){chart2.series[0].setData([29.9,71.5,106.4,129.2,144.0,176.0,135.6,148.5,216.4,194.1,95.6,54.4]);$(this).attr('disabled',true);$('#2013').attr('disabled',false);});
We can also transform these two buttons into a dropdown list:
// The select action
$("#selectData").on('change',function(){varselVal=$("#selectData").val();if(selVal=="2014Data"||selVal==''){chart2.series[0].setData([29.9,71.5,106.4,129.2,144.0,176.0,135.6,148.5,216.4,194.1,95.6,54.4]);}elseif(selVal=="2013Data"){chart2.series[0].setData([129.2,144.0,176.0,135.6,148.5,216.4,194.1,95.6,54.4,29.9,71.5,106.4]);}});
This uses highcharts chart.series.setData() function. What if we want to add another data series?
<button id="add">Add data 1</button>
<button id="remove" disabled="disabled">Remove data 1</button>
Lastly we want to combine the above add/remove buttons into one by switching it’s owen ids and text:
<button class="buttonToggle" id="buttonAdd">Add/Remove data 2</button>
Using $(this).attr(“id”, “newId”) and $(this).text(“Button text”).
1
2
3
4
5
6
7
8
9
10
11
12
13
14
15
$('.buttonToggle').click(function(){if($(this).attr("id")==="buttonAdd"){chart2.addSeries({name:'XYZ',id:'xyz',data:[9.9,151.5,196.4,209.2,4.0,26.0,275.6,40.5,166.4,34.1,95.6,254.4]});$(this).attr("id","buttonRm");$(this).text('Remove data 2');}else{$(this).attr("id","buttonAdd");$(this).text('Add data 2');chart2.get('xyz').remove();}});