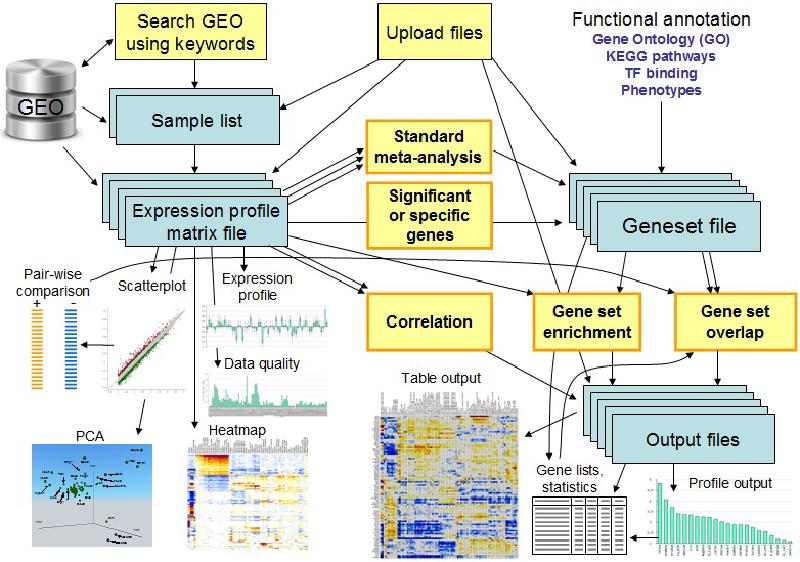
(Title image from ExAtlas)
Raw sequence data
Apart from publications, we can find a list of rescources for genome-wide expression data (see Table 1).
wget / curl -o URL
- Base quality
Sequence QC: fastQC, PRINSEQ, Trimmomatic
fastqc READSFILE
Filtering low-quality reads / trimming: Trimmomatic, FastX, PRINSEQ
-
Ambiguous bases
-
Adapters: TagCleaner, CutAdapt
-
Read length
-
Sequence-specific bias
-
GC-content
-
Duplicates (for DGE analysis not recommended to remove duplicates)
-
Sequence contamination
-
Low-complexity sequence / polyA tails
Mapping to reference genome
STAR, Bowtie, TopHat, Hisat2
STAR mapping [and counting, STAR counts pair-end reads as one read]
STAR --runThreadN 8 --genomeDir STAR_index_dir --readFilesIn XXX.fastq.gz --readFilesCommand zcat --alignIntronMin 10 --outSAMtype BAM SortedByCoordinate --outFileNamePrefix XXX_ [--sjdbGTFfile REF.gtf --quantMode GeneCounts]
Hisat2 mapping
hisat2 -p 8 hisat2_index_dir -U XXX.fastq -q -S OUTFILE.sam
Mapping stats:
stamtools flagstat XXX.bam/.sam
or to use RseQC
Transcriptome assembly
Mapping-based assembly
Cufflinks and Scripture
de novo assembly
Trinity or Velvet + Oases
Read counts from reference annotation
Reads per gene
HTSeq-count (slow)
htseq-count -f bam -s reverse XXX.bam REF.gtf > XXX.counts.txt
The output of htseq-count is quite simple: gene and read counts
|
|
and featureCounts (fast).
featureCounts -t exon -g gene_id -a REF.gtf -o XXX.counts.txt FILEIN.sam
gives quite comprehensive output, including gene start, end, lenght, and reads from specific sam file
|
|
Reads per transcript
Cufflinks, eXpress
Reads per exon
For differential exon usage: R package - DEXSeq
Data exploration
Correlation between biological samples, PCA/MDS/Sample Distance Matrix.
Data normalisation
- RPKM/FPKM
- TPM
- TMM (edgeR): batch normalisation method
- DESeq2 (can automatic filter lowly expressed genes)
Output can be normalised counts or rpkm or cpm.
Differential expression
Based on negative binomial distribution
edgeR: glmLRT(fit, contrast = contrast)
DESeq2: results(dds, contrast = (a, b))
Be aware of zero inflation.
Based on Possion-Tweedie
tweeDESeq
Visualisation
Bar/line chart, heatmap, volcano plot, MA plot, Idiogram, gene/transcript structures (R: ggbio)
Interactive visualisation: plotly, d3, highcharts, etc.
Functional
Blast, GO (GOstats, globaltest), Pathway (KEGG), domains (Batch CD-search), protein classification (NCBI SPARCLE)
Available whole pipeline tools:
- Zika-RNAseq-Pipeline (Python + R)
- RNA-seq workflow at the gene level
Meta-analysis examples:
- Meta-analysis of RNA-seq expression data across species, tissues and studies (in Genome Biology 2015)
- Differential meta-analysis of RNA-seq data from multiple studies (in BMC Bioinformatics 2014)
- Meta-analysis of gene expression studies in endometrial cancer identifies gene expression profiles associated with aggressive disease and patient outcome (in Sci Rep 2016)