Actually there is a very simple solution without need to search for specific functions. But it did not come to my mind in the past several days, when I tried to use apply and its variants and to set up function or a loop inside the rows and columns. The idea is to set the maxmium value in each row to 1 and the rest values scaled.
Now comes the easiest way.
1. To make a single plot
Assume that you have a matrix called ‘mx’ and you want to make a barplot for a specific row “gene_id_1”
|
|
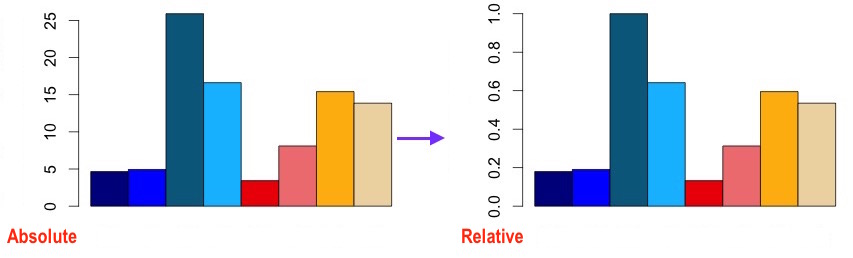
So the keypoint is mx[idx, ]/max(mx[idx,], which divides each row element by the largest one in this row.
2. To plot all rows and make each row a single barplot
A for loop just did the right thing.
|
|
3. To define rows from a file (or input) and make batch plotting
Add this to your script:
|
|
And use mx[GI[i],]/max(mx[GI[i],]).